ANALYSIS & OPTIMIZATION OF LIFTING LUG ACCORDING TO LOAD CONDITIONS
Introduction
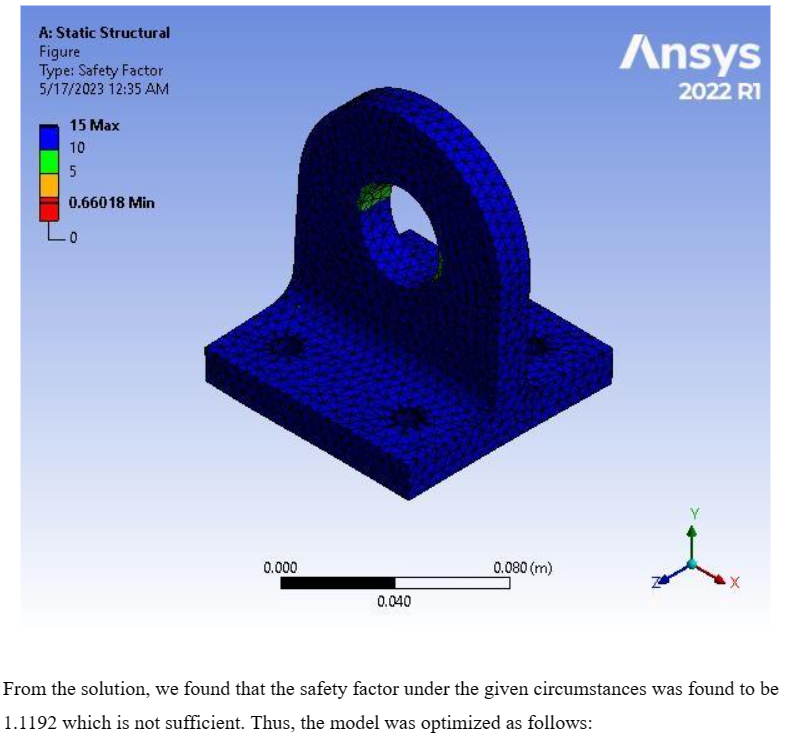
The main focus of this project was to analyze the existing lifting lug under the set load conditions and observe its behavior. The different analysis like: Stress-strain analysis, deformation, safety factors were obtained using ANSYS workbench. The results were not satisfactory. We then optimized the model so that the model would sustain with respect to load conditions. During the process, various parameters were selected as input and output parameters for optimization.
Keywords:- ANSYS Workbench 2022, Lifting Lug, Stress-strain Analysis, Total Deformation, Safety Factor, Optimization.
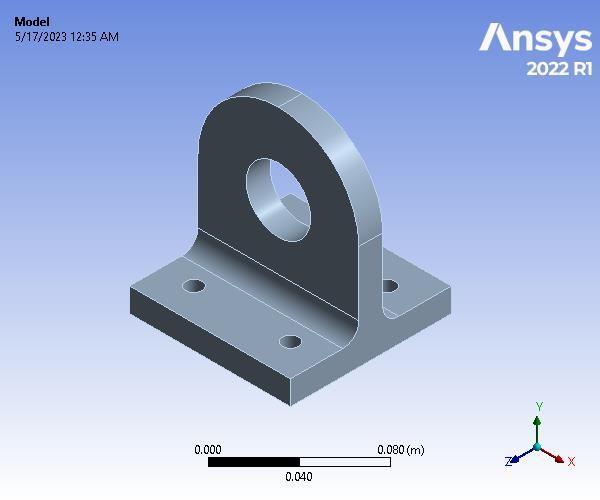
As lifting lug is a thin plate with a hole in it which assists in raising/lifting objects in different cases, it must be hard and must withstand the load subjected to it without undergoing any deformation.
Structural steel is a category of steel used for making construction materials in a variety of shapes. Structural steel shapes, sizes, chemical composition, mechanical properties such as strengths, storage practices, etc., are regulated by standards in most industrialized countries. Most structural steel shapes, such as I-beams, have high second moments of area, which means they are very stiff in respect to their cross-sectional area and thus can support a high load without excessive sagging. Therefore, we have selected structural steel for the model.
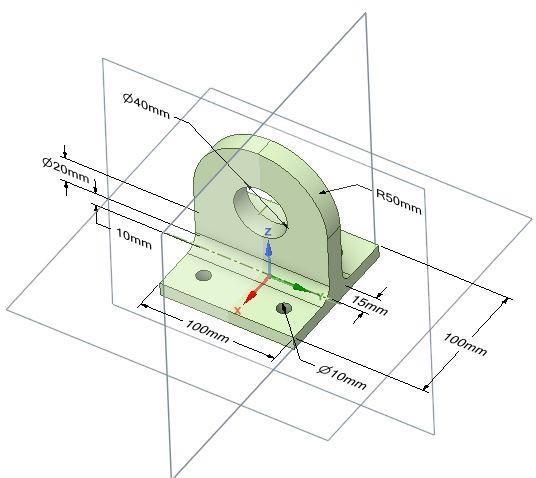
 The model is designed to withstand the bearing load as follow:
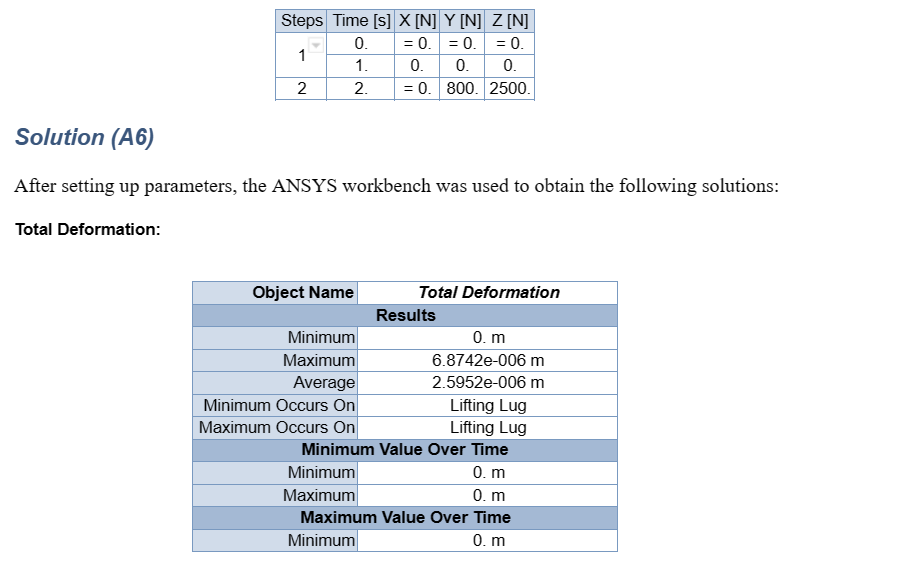
Bearing Load

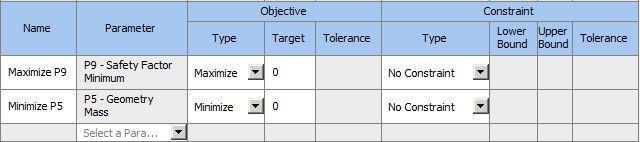
Design Optimization
First of all, the parameters were selected on whose basis the design was to be optimized. Outline of Schematic Parameters:
|
S.N. |
INPUT PARAMETER |
OUTPUT PARAMETER |
|
1 |
Base Thickness |
Safety Factor |
|
2 |
Vertical Thickness |
Geometry Mass |
|
3 |
Fillet Radius |
|
Following constraints were setup:
Domain of Input Parameters:
|
Input Parameters |
|||
|
Name |
Lower Bound |
Upper Bound |
|
|
P10 - FilletRadius (mm) |
9 |
11 |
|
|
P11 - VerticalThickness (mm) |
10 |
10.6 |
|
|
P12 - BaseThickness (mm) |
10.5 |
11.5 |
|
|
Parameter Relationships |
|||
|
Name |
Left Expression |
Operator |
Right Expression |
|
New Parameter Relationship |
|
|
|
The model was analyzed under 15 different sets of design points to check how the system responded under above conditions. The results obtained were as follows:
|
Name |
P10 - FilletRadius (mm) |
P11 - VerticalThickness (mm) |
P12 - BaseThickness (mm) |
P5 - Geometry Mass (kg) |
P9 - Safety Factor Minimum |
|
1 |
9.066666667 |
10.02 |
10.53333333 |
1.431913622 |
0.689172201 |
|
2 |
9.2 |
10.32 |
10.86666667 |
1.476142521 |
0.707393408 |
|
3 |
9.333333333 |
10.17 |
11.2 |
1.493287875 |
0.759651334 |
|
4 |
9.466666667 |
10.47 |
10.64444444 |
1.469955089 |
0.680159003 |
|
5 |
9.6 |
10.095 |
10.97777778 |
1.47357664 |
0.700520798 |
|
6 |
9.733333333 |
10.395 |
11.31111111 |
1.517853457 |
0.775980239 |
|
7 |
9.866666667 |
10.245 |
10.75555556 |
1.467461085 |
0.699319639 |
|
8 |
10 |
10.545 |
11.08888889 |
1.511761861 |
0.737493888 |
|
9 |
10.13333333 |
10.0575 |
11.42222222 |
1.508657449 |
0.77698146 |
|
10 |
10.26666667 |
10.3575 |
10.57037037 |
1.462867992 |
0.689365856 |
|
11 |
10.4 |
10.2075 |
10.9037037 |
1.480109182 |
0.70869156 |
|
12 |
10.53333333 |
10.5075 |
11.23703704 |
1.524457876 |
0.786750182 |
|
13 |
10.66666667 |
10.1325 |
10.68148148 |
1.460589619 |
0.699476961 |
|
14 |
10.8 |
10.4325 |
11.01481481 |
1.504962273 |
0.722480504 |
|
15 |
10.93333333 |
10.2825 |
11.34814815 |
1.522251381 |
0.783492985 |
It is clear from the above data that the domain set for the design point failed to give the required factor of safety. Hence, second iteration was done by studying the above table and setting new domain for the input parameters.
This time only two parameters were selected as input parameters under the following domains and different design points were evaluated.
|
Input Parameters |
|||
|
Name |
Lower Bound |
Upper Bound |
|
|
P11 - VerticalThickness (mm) |
13 |
28 |
|
|
P12 - BaseThickness (mm) |
13 |
20 |
|
|
Parameter Relationships |
|||
|
Name |
Left Expression |
Operator |
Right Expression |
|
New Parameter Relationship |
|
|
|
The model was again analyzed under 20 different sets of design points and 5 best design points were obtained.
|
Name |
P11 - VerticalThickness (mm) |
P12 - BaseThickness (mm) |
P5 - Geometry Mass (kg) |
P9 - Safety Factor Minimum |
|
1 |
13.375 |
13.175 |
1.840777664 |
0.888823914 |
|
2 |
14.125 |
16.675 |
|
|
|
3 |
14.875 |
14.925 |
2.064155316 |
1.045175934 |
|
4 |
15.625 |
18.425 |
|
|
|
5 |
16.375 |
14.05 |
2.087944113 |
0.971759668 |
|
6 |
17.125 |
17.55 |
|
|
|
7 |
17.875 |
15.8 |
|
|
|
8 |
18.625 |
19.3 |
|
|
|
9 |
19.375 |
13.6125 |
2.253812262 |
0.958886415 |
|
10 |
20.125 |
17.1125 |
|
|
|
11 |
20.875 |
15.3625 |
|
|
|
12 |
21.625 |
18.8625 |
|
|
|
13 |
22.375 |
14.4875 |
2.530572514 |
0.972085782 |
|
14 |
23.125 |
17.9875 |
|
|
|
15 |
23.875 |
16.2375 |
|
|
|
16 |
24.625 |
19.7375 |
|
|
|
17 |
25.375 |
13.39375 |
2.657361985 |
0.729956675 |
|
18 |
26.125 |
16.89375 |
|
|
|
19 |
26.875 |
15.14375 |
|
|
|
20 |
27.625 |
18.64375 |
|
|
The candidate point 5 was chosen as the best design point for our model on the basis of best combination of factor of safety and mass.


|
Reference |
Name |
P11 - VerticalThickness (mm) |
P12 - BaseThickness (mm) |
P5 - Geometry Mass (kg) |
P9 - Safety Factor Minimum |
||
|
Parameter Value |
Variation from Reference |
Parameter Value |
Variation from Reference |
||||
|
Candidate Point 1 |
13.375 |
13.175 |
1.840777664 |
-18.33% |
0.888823914 |
-7.31% |
|
|
|
Candidate Point 2 |
14.875 |
14.925 |
2.064155316 |
-8.41% |
1.045175934 |
9.00% |
|
|
Candidate Point 3 |
19.375 |
13.6125 |
2.253812262 |
0.00% |
0.958886415 |
0.00% |
|
|
Candidate Point 4 |
22.375 |
14.4875 |
2.530572514 |
12.28% |
0.972085782 |
1.38% |
|
|
Candidate Point 5 |
25.375 |
13.39375 |
2.657361985 |
17.91% |
0.729956675 |
-23.87% |
|
|
New Custom Candidate Point |
20.5 |
16.5 |
|
|
|
|
From the above table, it is clear that the candidate point 2 is the best design point from the above options, thus, its values were copied to the current design point and model was simulated to obtain the following results.
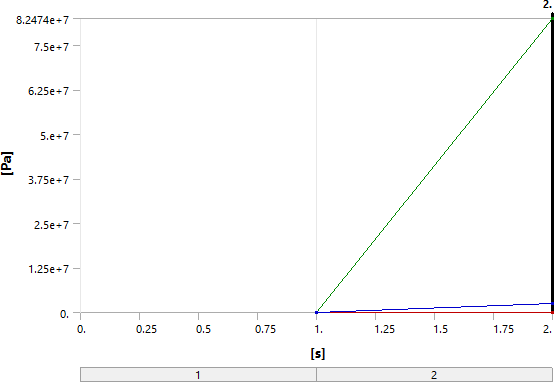
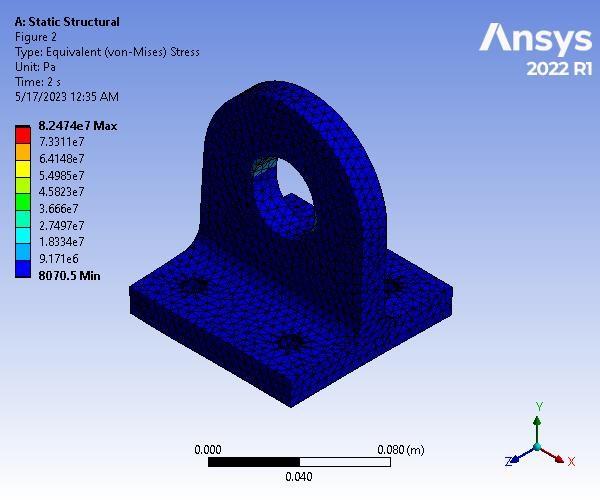
Solutions Information
Solution Information Results
|
Object Name |
Total Deformation |
Equivalent Stress |
|
Results |
||
|
Minimum |
0. m |
8070.5 Pa |
|
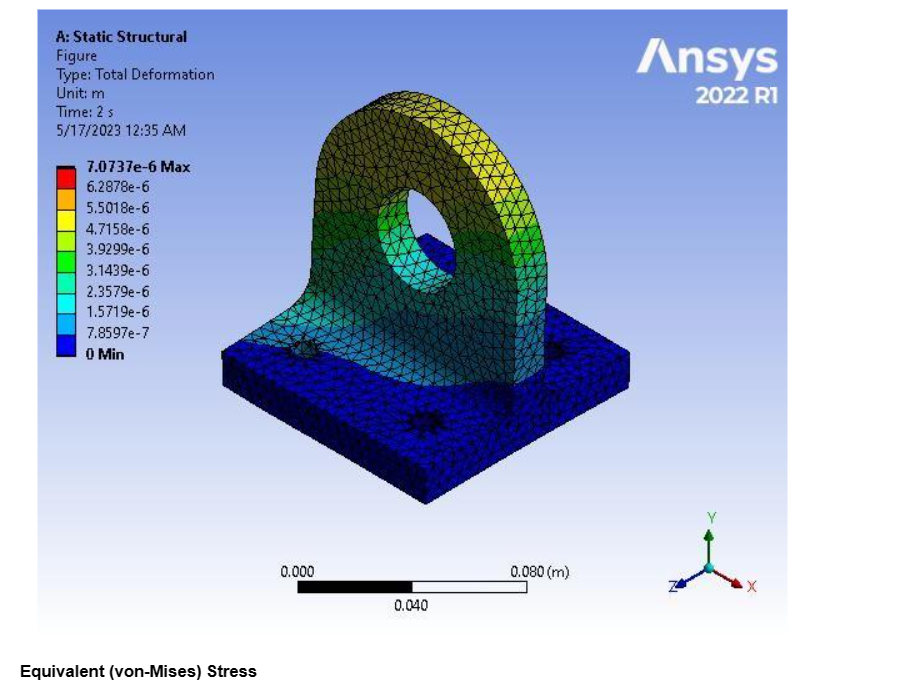
Maximum |
5.4486e-006 m |
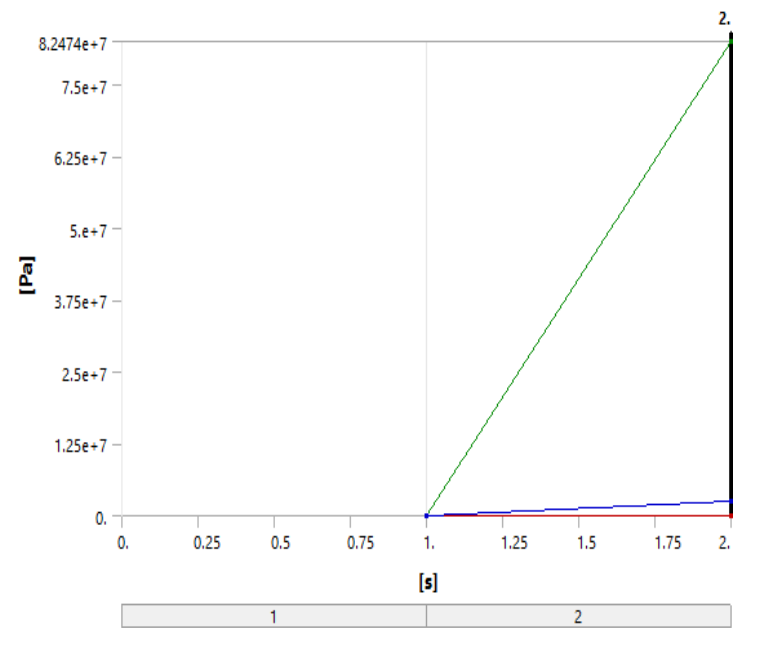
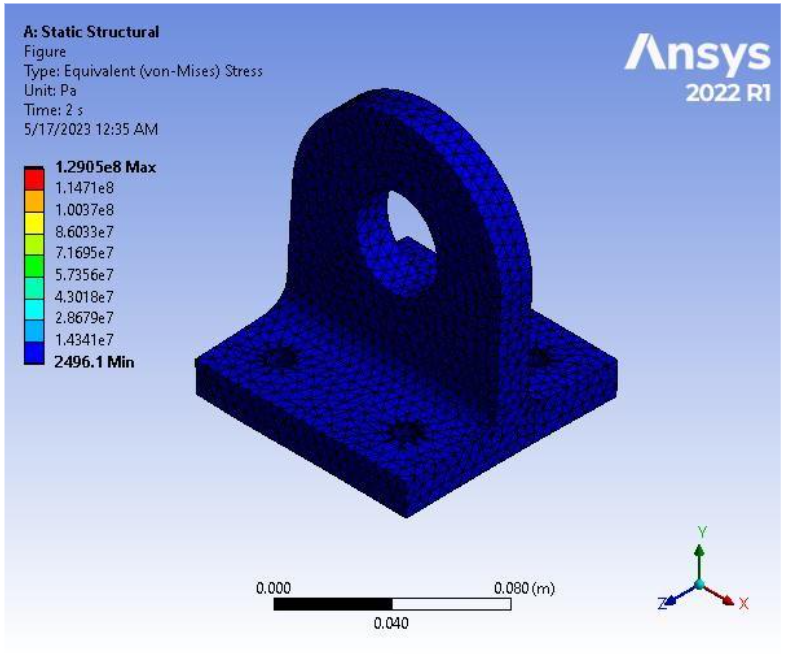
8.2474e+007 Pa |
|
Average |
1.6936e-006 m |
2.5351e+006 Pa |
|
Minimum Occurs On |
Lifting Lug |
|
|
Maximum Occurs On |
Lifting Lug |
|
|
Minimum Value Over Time |
||
|
Minimum |
0. m |
0. Pa |
|
Maximum |
0. m |
8070.5 Pa |
|
Maximum Value Over Time |
||
|
Minimum |
0. m |
0. Pa |
|
Maximum |
5.4486e-006 m |
8.2474e+007 Pa |
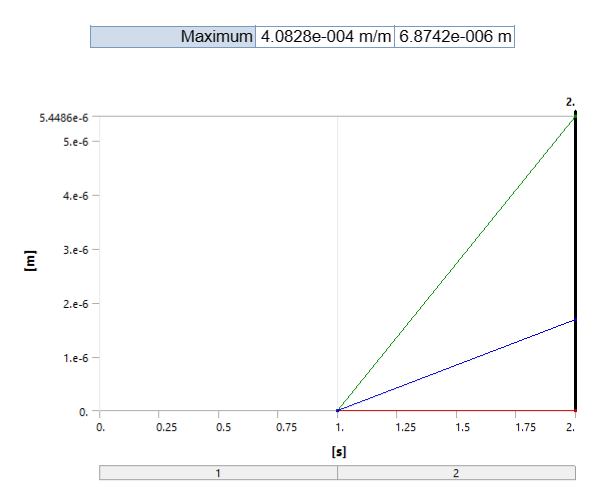
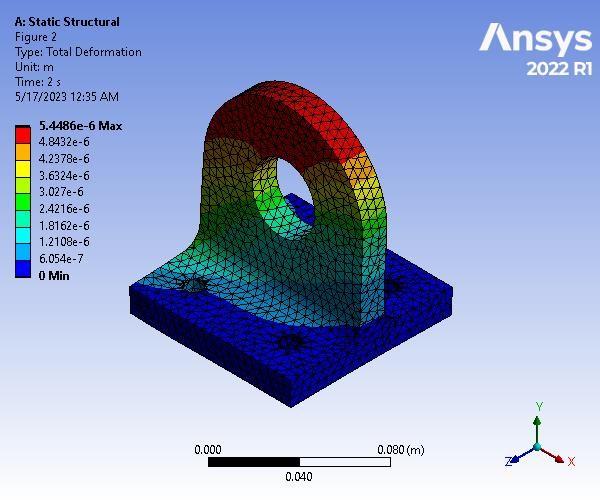
Total Deformation

Figure
Equivalent Stress
Figure
Fatigue Tools
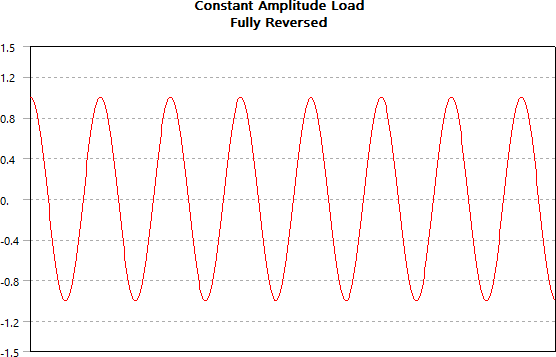

Results
|
Object Name |
Life |
Safety Factor |
|
Definition |
||
|
Design Life |
|
1.e+009 cycles |
|
Results |
||
|
Minimum |
1.e+006 cycles |
1.0452 |
|
Minimum Occurs On |
Solid |
|
Figure

Conclusion
|
S.N. |
NAME |
INITIAL VALUES |
OPTIMIZED VALUE |
OBJECTIVE |
VARIATION FROM REFERENCE |
|
1 |
Total Deformation |
6.87E-06 |
5.45E-06 |
Minimize |
-2.07E+01 |
|
3 |
Safety Factor Minimum |
0.66018 |
1.0452 |
Maximize |
5.83E+01 |
Appendix Units
Geometry
TABLE 1
|
Unit System |
Metric (m, kg, N, s, V, A) Degrees rad/s Celsius |
|
Angle |
Degrees |
|
Rotational Velocity |
rad/s |
|
Temperature |
Celsius |
Structural Steel
TABLE 4
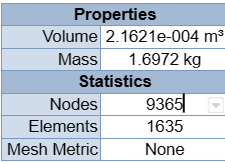
Model (A4) > Geometry
|
Properties |
|
|
Volume |
2.1621e-004 m³ |
|
Mass |
1.6972 kg |
|
Statistics |
|
|
Nodes |
9365 |
|
Elements |
1635 |
|
Mesh Metric |
None |
TABLE 31
Structural Steel > Constants
|
Density |
7850 kg m^-3 |
|
Coefficient of Thermal Expansion |
1.2e-005 C^-1 |
|
Specific Heat |
434 J kg^-1 C^-1 |
|
Thermal Conductivity |
60.5 W m^-1 C^-1 |
|
Resistivity |
1.7e-007 ohm m |
TABLE 32
Structural Steel > Color
|
Red |
Green |
Blue |
|
132 |
139 |
179 |
TABLE 33
Structural Steel > Compressive Ultimate Strength
|
Compressive Ultimate Strength Pa |
|
0 |
TABLE 34
Structural Steel > Compressive Yield Strength
|
Compressive Yield Strength Pa |
|
2.5e+008 |
TABLE 35
Structural Steel > Tensile Yield Strength
|
Tensile Yield Strength Pa |
|
2.5e+008 |
TABLE 36
Structural Steel > Tensile Ultimate Strength
|
Tensile Ultimate Strength Pa |
|
4.6e+008 |
TABLE 37
Structural Steel > Isotropic Secant Coefficient of Thermal Expansion
|
Zero-Thermal-Strain Reference Temperature C |
|
22 |
TABLE 38
Structural Steel > S-N Curve
|
Alternating Stress Pa |
Cycles |
Mean Stress Pa |
|
3.999e+009 |
10 |
0 |
|
2.827e+009 |
20 |
0 |
|
1.896e+009 |
50 |
0 |
|
1.413e+009 |
100 |
0 |
|
1.069e+009 |
200 |
0 |
|
4.41e+008 |
2000 |
0 |
|
2.62e+008 |
10000 |
0 |
|
2.14e+008 |
20000 |
0 |
|
1.38e+008 |
1.e+005 |
0 |
|
1.14e+008 |
2.e+005 |
0 |
|
8.62e+007 |
1.e+006 |
0 |
TABLE 39
Structural Steel > Strain-Life Parameters
|
Strength Coefficient Pa |
Strength Exponent |
Ductility Coefficient |
Ductility Exponent |
Cyclic Strength Coefficient Pa |
Cyclic Strain Hardening Exponent |
|
9.2e+008 |
-0.106 |
0.213 |
-0.47 |
1.e+009 |
0.2 |
TABLE 40
Structural Steel > Isotropic Elasticity
|
Young's Modulus Pa |
Poisson's Ratio |
Bulk Modulus Pa |
Shear Modulus Pa |
Temperature C |
|
2.e+011 |
0.3 |
1.6667e+011 |
7.6923e+010 |
|